What return does AI visual inspection actually give?
Adopting AI visual inspection, and working out the return
What this article covers
What most companies want to know about AI visual inspection is how long it takes to pay back — the return on investment. Return on investment divides the benefit by the amount invested, and says quantitatively how much comes back, and over what period.
This article sets out what goes into that calculation and works an example on stated assumptions. There is also a simulator at the end, so you can put your own company’s numbers in and see your own payback period.
What a return calculation needs, with a worked example
To see the return properly, you first need a view of what the investment gives you and what it costs.
The parts of the calculation
| The benefit (return) | The cost |
|---|---|
| Costs cut ・Labour ・Training ・Re-inspection and rework ・Handling complaints ・The effect of losing trust |
Initial cost ・Inspection software (the eyes and brain) ・Transport and handling (the hands and feet) Running cost ・Software running cost ・Labour for running and maintaining it |
| Value added ・Production improvement from the defect data collected |
Other indirect cost ・Support alongside training and quality improvement |
The usual calculation you see judges on labour cost and investment alone. This article adds the other costs that can be cut but are rarely counted, works the figures on realistic assumptions, and sets out the return from several angles.
The text works through a set of assumptions for clarity; lower down there is a simulator you can put your own conditions into.
Assumptions
- Annual sales of the line the AI visual inspection goes on: ¥500 million
- Inspectors on that product: 1
On that basis, let us look at the return from both the benefit side and the investment side.
The benefit
The easy part: labour actually costs about 1.5 times the hourly rate
The most obvious return is the labour saved. Take the hardest case for payback — a part-time inspector, one per line, eight hours a day at ¥1,200 an hour. At 250 operating days a year, that is about ¥2.4 million a year in simple terms.
What the company actually bears is more than that. With the employer’s share of social insurance, and the cost of recruiting, training and managing, the real labour cost is said to reach 1.4 to 1.6 times the nominal hourly rate. (Approximately, from METI’s analysis of labour cost structure and SME Agency material.)
So even an inspector at ¥1,200 an hour really costs the company ¥1,700 to ¥1,900 an hour — about ¥3.5 to ¥3.8 million a year per person.
The hard part: training, re-inspection, complaints, lost trust
The cost of training
On what companies spend training their people, the Sanro Research Institute’s 2024 survey of training expenditure reports an average of ¥34,606 per employee (e-sanro.net).
That survey does not include the time of the person doing the training, or the labour cost of on-the-job training. In practice both the person giving and the person receiving the training spend time on it, so adding the opportunity cost of OJT is the realistic view.
This article calculates training cost as:
OJT cost per person = hourly rate × true cost multiplier × monthly hours × OJT share × 2
Training cost per person = direct training cost + OJT cost
For the part-time inspector above (¥1,200 an hour, multiplier 1.5) working 160 hours a month (8 hours × 20 days) with a tenth of that given to training:
1,200 × 1.5 × 160 × 0.1 × 2 = ¥57,600
The × 2 at the end accounts for both the person training and the person being trained being occupied.
Add the direct training cost (¥34,606) and the annual training cost in this case is 57,600 + 34,606 = ¥92,206 per person.
That is the real cost of training: the direct cost plus the opportunity cost of OJT.
Re-inspection and rework (dealing with it before the product ships)
A report in the journal of the Japanese Society for Quality Control (JUSE) puts internal defect and rework cost in manufacturing at around 0.05% to 0.2% of sales. Take the midpoint, 0.1%: on ¥500 million of annual sales, about ¥500,000 a year.
Complaints and escaped defects (dealing with it after the product ships)
JUSE’s survey of quality trouble costs puts the cost of quality trouble in the market at 0.05% to 0.5% of sales (JUSE, quality management research reports). Conservatively, take 0.1% of ¥500 million: ¥500,000.
Lost trust (damage to the brand)
A defect escaping to the market because the inspection missed it is a serious risk to a company’s standing. Once a defect is known to customers or to the public, it affects not only the immediate recall but long-term brand value and trading relationships.
The automotive industry has several examples where quality misconduct or a concealed recall sent sales and the share price down sharply. In the Mitsubishi Fuso recall affair, domestic sales fell by about 30% for a time; Kobe Steel’s share price fell about 30% immediately after the disclosure; Toyota’s US Prius sales were reported down nearly 20% in some months.
Loss of trust is infrequent, then, but when it happens it can cost tens of per cent of sales. Given that shape of risk — rare but severe — this article works it as an expected value: a 1% to 5% loss of sales at a 10% likelihood.
The invisible costs added up (on a ¥500 million line)
| Cost | Share of sales | Amount | Source |
|---|---|---|---|
| Training (1% against QA) | 0.018% | ¥90,000 | Sanro Research Institute, JUSE |
| Re-inspection and rework | 0.1% | ¥500,000 | Japanese Society for Quality Control |
| Handling complaints | 0.1% | ¥500,000 | JUSE quality management research |
| Lost trust (expected value) | 0.2% | ¥1,000,000 | PeopleWork report |
Total: about 0.42%, or ¥2.09 million a year.
So the invisible costs alone run to around ¥2.09 million a year. Cut 30% of them with AI and that is about ¥630,000 a year. Add the labour of one inspector (about ¥3.5 million) and the benefit comes to ¥4.1 million a year.
The cost
Adopting AI visual inspection costs money, naturally. The structure divides into the initial cost and the running cost.
Initial cost
Put in human terms, what an inspection needs divides into the eyes and brain, and the hands and feet.
In an AI visual inspection project those are two separate things to buy.
- Inspection software (the eyes and brain)
- Transport and handling (the hands and feet)
Inspection software (eyes and brain)
The cost of building the apparatus for seeing and judging: camera, lighting, inference model, training environment, user interface. It varies widely with the subject and the method.
| Part | What it covers | Range |
|---|---|---|
| Hardware | Camera, lighting, PC (GPU) | ¥300,000 – ¥1.5 million |
| Software | Building the model, developing the inspection UI, licence, tuning, validation | ¥500,000 – ¥10 million and up |
Together, an AI inspection software project typically runs ¥1 million to ¥5 million.
Transport and handling (hands and feet)
Even when the AI can see and judge, the inspection needs hands and feet: moving the product, carrying it under the camera, ejecting the NG parts. This is the largest source of variation in what an AI project costs.
| Part | What it covers | Range |
|---|---|---|
| Transport | Conveyor, tray transport, positioning | ¥500,000 – ¥5 million and up |
| Ejection | NG ejection, cylinders, actuator control | ¥300,000 – ¥2 million and up |
| Robots and jigs | Collaborative robot, custom gripper, jig design | ¥1 million – ¥10 million and up |
| Overall design | Requirements, hardware and software design, assembly, commissioning | ¥1 million – ¥10 million and up |
| Feeding and buffering | Bucket feed, stacked trays, rotary feeder | ¥1 million – ¥5 million and up |
Handling in particular runs from hundreds of thousands to tens of millions of yen, depending on the size and weight of the subject, safety regulation, and where it is installed.
Running cost
If the initial cost is the lump sum at the start, the running cost is what maintaining and operating it costs every year. It divides into software fees and labour for running and maintaining.
Software running cost
Where the AI inspection software is licensed or used as a cloud service, there is often an annual maintenance and support fee.
| Item | What it covers | Guide |
|---|---|---|
| Licence, maintenance and support | Fixing faults, updates, technical support | ¥100,000 – ¥2 million a year |
Labour for running and maintaining
Running an AI system involves regular work:
- Registering and classifying new defect images
- Checking the judgements and adjusting the threshold
- Adjusting and maintaining the position of cameras and lighting
- Periodic retraining and accuracy checks
For a permanent employee on ¥5 million a year (¥2,125 an hour) spending about one day, eight hours, a month on it: 2,125 × 1.5 × 8 × 12 ≈ ¥300,000 a year. In practice this is usually done alongside other duties, so ¥300,000 to ¥500,000 a year is a realistic estimate.
This operating labour is almost never estimated at the time of purchase. Which is why we hear of management asking, afterwards, why so much time is going into something they bought to save it.
On which point, our Zero-Training AI, which applies generative AI to inspection, cuts the time that adoption and operation take considerably. See the article below.
Want AI inspection but cannot collect defects? That is what Zero-Training AI is for
Initial plus running, as an annual figure
| Category | Approximate range |
|---|---|
| Initial: inspection software (eyes and brain) | ¥1 million – ¥10 million and up |
| Transport and handling (hands and feet) | ¥1 million – ¥20 million and up |
| Running: software | ¥100,000 – ¥2 million a year |
| Operating and maintenance labour | ¥300,000 – ¥1 million a year |
First-year total, roughly: ¥2.4 million to ¥33 million and up.
Taking all that together, it is barely an exaggeration to say that whether the return works out is decided by how much of the hands part of a manual inspection you automate. Accuracy is mostly carried by the inspection software; cost is mostly driven by the automation machinery. People weighing up AI visual inspection tend to spend their time comparing software, and considering the automation in parallel is one of the ways to improve the return.
Three things that keep a return calculation honest
Having worked through the parts of the calculation with concrete figures, three points will sharpen your own.
- Count labour at 1.5 times the nominal hourly rate (so that social insurance, recruitment and training are in the real figure)
- Be clear about the scope of the AI project (eyes and brain only, or hands and feet too — the initial investment differs several-fold)
- Include the invisible costs (training, re-inspection, complaints, lost trust add tens of per cent to the saving)
AI visual inspection is not a cost-cutting tool; it is where improvement starts
So far this has been a comparison of costs saved against money spent. But AI visual inspection is not merely a device for cutting cost. Analyse the defect images the AI captures alongside the production data from the process and you can see variation and abnormal tendencies in the process, and work towards better yield and better design quality.
In Japan, since laying off permanent staff is not straightforward, automating an inspection can take people out of a process without that translating directly into a lower cost. The real purpose is rather to move limited people to more creative work, where what they are actually good at counts.
Automation with AI is not a mechanism for removing people. It is a mechanism for taking weight off them, so their time goes to judgement and improvement. What comes of that is a floor that is both easier to work on and steadier in quality.
In other words, AI inspection is both a way of keeping defects from reaching the next process and a sensor for improving production. The return is not something you calculate once before buying; it is a figure that gets better after you buy. The benefit you can see in numbers, and the benefit that accumulates from using the data. A company that keeps both in view will use AI visual inspection as an asset rather than a cost.
Try it with your own numbers
The figures so far are a general model; the actual return differs a great deal with the industry, the product and the shape of the line. So, using every item described above, here is a simulator you can put your own numbers into.
It will show you what saving to expect and how many years the payback takes. Use it while you are evaluating, or for material to explain the case inside your company.
ROI simulator
Change anything on the benefit side or the cost side and the return is recalculated at once.
Behind "show or hide the detailed settings" are the rework and complaint rates against sales, along with a range of other inputs.
- Annual benefit
- Optimistic case– / year
- Pessimistic case– / year
- Payback period
- Optimistic case–
- Pessimistic case–
- NPV (7 years, future benefit discounted at 7%)
- Optimistic case–
- Pessimistic case–
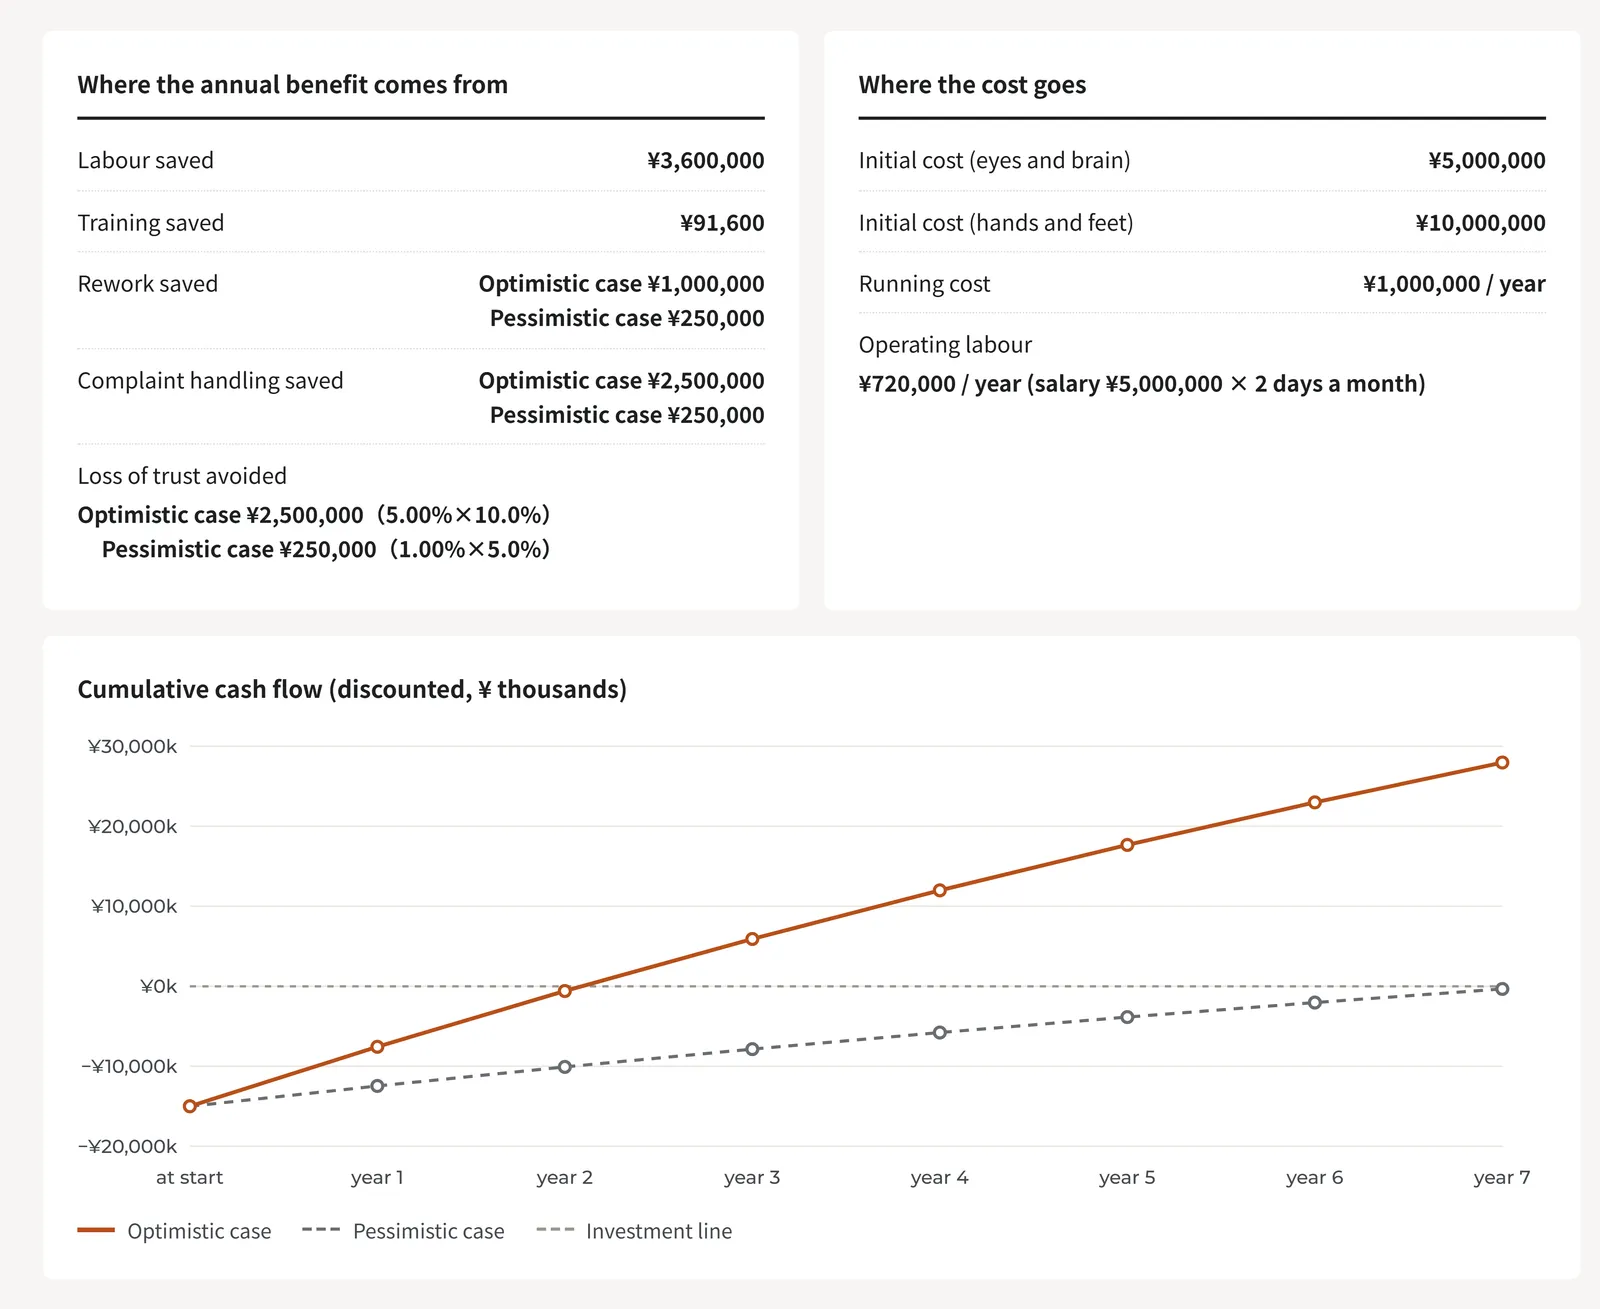
The optimistic case assumes a large benefit — plenty of room to cut defects and complaints. The pessimistic case assumes a small one, where there were few defects and complaints to begin with.
Where the annual benefit comes from
- Labour saved–
- Training saved–
- Rework saved–
- Complaint handling saved–
- Loss of trust avoided–
Where the cost goes
- Initial cost (eyes and brain)–
- Initial cost (hands and feet)–
- Running cost–
- Operating labour–
The formulas
- Labour saved = hourly rate × true cost multiplier × operating days × hours a day × number of inspectors
- Training saved = (direct training cost × inspectors) + {20 days × hours a day × OJT share × hourly rate × multiplier × 2 × inspectors} ÷ years between inspector changes
- Re-inspection saved = sales × re-inspection rate
- Complaint handling saved = sales × complaint rate
- Loss of trust avoided = sales × fall in sales × likelihood
- Operating labour = annual salary × multiplier ÷ operating days × maintenance days a month × 12
- Annual benefit (optimistic / pessimistic) = (labour + training + re-inspection + complaints + lost trust) × share of the saving realised
- NPV (7 years) = the sum of each year’s (annual benefit − running cost), discounted to present value
References
- Sanro Research Institute: 2024 survey of training expenditure — reports ¥34,606 per employee.
- Kazuyuki Suzuki, on quality trouble cost and local procurement management — material related to the Union of Japanese Scientists and Engineers (JUSE). Reports re-inspection and rework cost in manufacturing at 0.05% to 0.2% of sales.
- Mitsubishi recall concealment: Wikipedia (Japanese) — domestic sales reported down about 30% for a time after the misconduct came out.
- Kobe Steel data falsification: Wikipedia — the share price fell about 30% immediately after disclosure.
- Toyota Prius recall: Yahoo Finance — sales reported down about 20% over part of the period.
- Reputation.com: “Companies with the highest reputation scores experience an average of 15% faster sales growth” — on the correlation between reputation score and sales growth.
- Aon: “Damage to Reputation or Brand: A Critical Risk” — 9% of respondents had suffered a loss from brand damage within the previous year.
These sources are public information, used as the basis for the model in this article (the expected values and the likelihoods).